Graph Data Science Services
Transforming Your Business with Expert Graph Data Science Services
This site is not optimized for Internet Explorer 9 and lower. Please choose another browser or upgrade your existing browser in order get the best experience of this website.
Transforming Your Business with Expert Graph Data Science Services
Are you struggling to make sense of vast and complex datasets and feeling overwhelmed and frustrated?
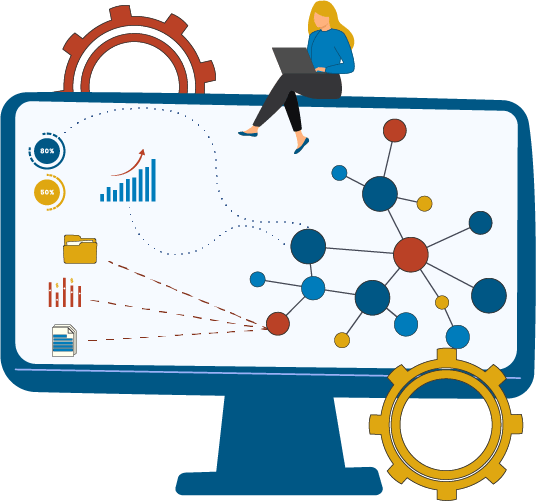
Our team of expert graph data scientists and AI engineers has the experience and tools necessary to transform your business. By analyzing your data sets with cutting-edge technology, we can uncover new patterns, relationships, and insights that would otherwise remain hidden. With this information, you’ll be able to make faster, more informed decisions that help you stay ahead of the competition.
How It Works
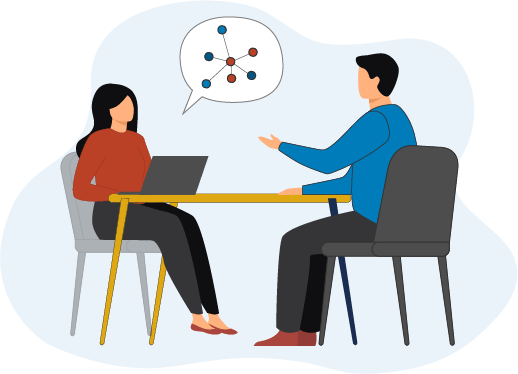
Consultation
We'll start with an initial consultation to understand your business needs and goals.
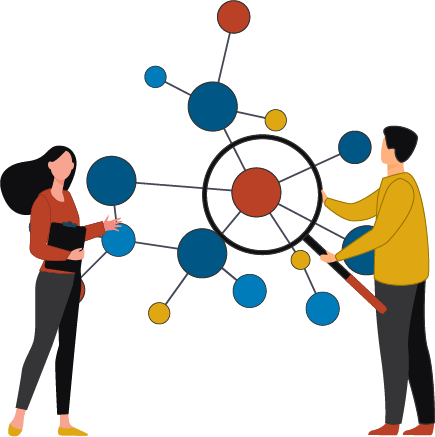
Data Analysis
Our team will analyze your data using state-of-the-art graph data science techniques.
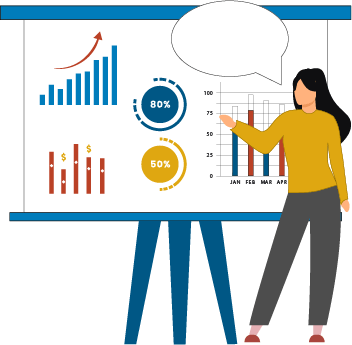
Insights
We'll deliver actionable insights and visualizations that help you understand your data and make informed decisions.
Implementation
If necessary, our team will help you implement the changes necessary to capitalize on this newfound knowledge.
“Our business was transformed after working with AtomRain. We were able to take on 50% more business without increasing headcount.” – Andy F., Partner
© **YEAR** AtomRain, Inc. All rights reserved.